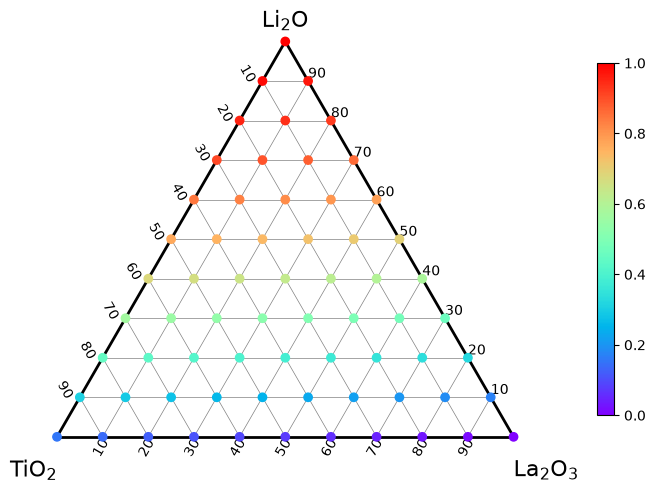
Scatter plot colored by values#
import matplotlib.pyplot as plt
import pandas as pd

from ternary_diagram import TernaryDiagram
df = pd.read_csv("example_scatter.csv")
df.head()
| Li2O | TiO2 | La2O3 | z | |
|---|---|---|---|---|
| 0 | 0.0 | 0.0 | 10.0 | 0.000000 |
| 1 | 0.0 | 1.0 | 9.0 | 0.015385 |
| 2 | 0.0 | 2.0 | 8.0 | 0.030769 |
| 3 | 0.0 | 3.0 | 7.0 | 0.046154 |
| 4 | 0.0 | 4.0 | 6.0 | 0.061538 |
materials = df.columns[0:3]
materials
Index(['Li2O', 'TiO2', 'La2O3'], dtype='object')
fig, ax = plt.subplots(facecolor="w", layout="constrained")
td = TernaryDiagram(materials=materials, ax=ax)
td.scatter(df[materials], z=df["z"], z_min=0, z_max=1)
<matplotlib.collections.PathCollection at 0x12f5247a0>
td.fig.savefig("example_scatter.png", dpi=144)