Scatter plot and tie lines#
import matplotlib.pyplot as plt
import pandas as pd

from ternary_diagram import TernaryDiagram
df = pd.read_csv("example_mono_scatter.csv")
df.head()
| Li2O | TiO2 | La2O3 | |
|---|---|---|---|
| 0 | 0 | 1 | 9 |
| 1 | 0 | 2 | 8 |
| 2 | 0 | 3 | 7 |
| 3 | 0 | 4 | 6 |
| 4 | 0 | 5 | 5 |
Plot#
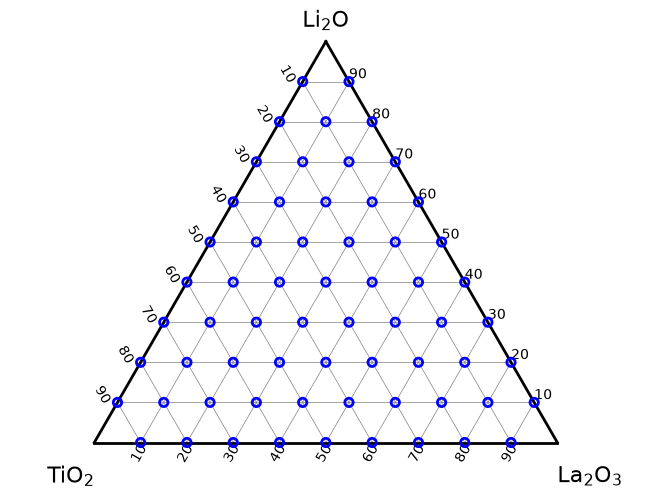
fig, ax = plt.subplots(facecolor="white", layout="constrained")
td = TernaryDiagram(df.columns, ax=ax)
td.scatter(df, color="blue", facecolor="None", lw=2)
<matplotlib.collections.PathCollection at 0x13acb7ec0>
Tie line#
fig, ax = plt.subplots(facecolor="w", layout="constrained")
td = TernaryDiagram(df.columns, ax=ax)
td.scatter(df.iloc[:10], label="<10")
td.scatter(df.iloc[10:], label=">10")
td.plot([[1, 0, 1], [0, 2, 3]], label="tie line")
td.ax.legend()
<matplotlib.legend.Legend at 0x1541246e0>
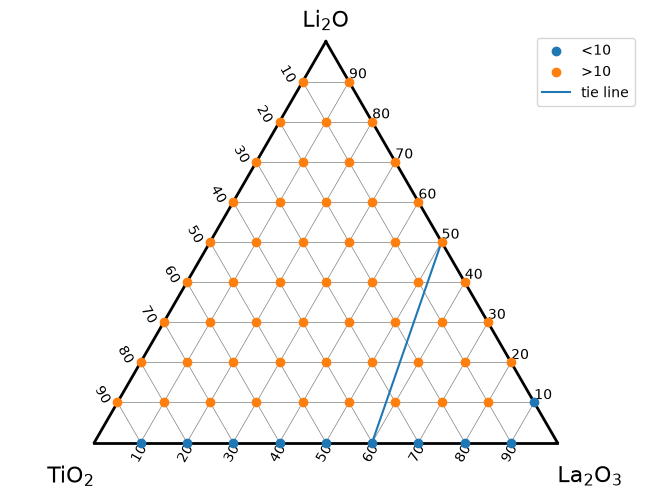
fig.savefig("example_mono_scatter.png", dpi=144)