Multiple diagrams in one figure#
Import modules
import os

import pandas as pd
import matplotlib.pyplot as plt

from ternary_diagram import TernaryDiagram
Create the figure with layout="constrained". Matplotlib’s constrained layout keeps the diagrams, their labels and the colorbar from overlapping each other, so you don’t need to adjust the layout afterwards or search for a large enough figsize. Pass each Axes to TernaryDiagram with ax=.
fig, axes = plt.subplots(
    1, 2, dpi=72, facecolor="white", figsize=(10, 3.6), layout="constrained"
)
fpath_example = ".."
fpath_contour = os.path.join(fpath_example, "contour", "example_contour.csv")
fpath_mono_scatter = os.path.join(
    fpath_example, "mono_scatter", "example_mono_scatter.csv"
)
df_contour = pd.read_csv(fpath_contour)
df_mono_scatter = pd.read_csv(fpath_mono_scatter)
display(df_contour.head(), df_mono_scatter.head())
| Li2O | TiO2 | La2O3 | z | |
|---|---|---|---|---|
| 0 | 0.0 | 0.0 | 50.0 | 0.000000 |
| 1 | 0.0 | 1.0 | 49.0 | 0.000755 |
| 2 | 0.0 | 2.0 | 48.0 | 0.001509 |
| 3 | 0.0 | 3.0 | 47.0 | 0.002264 |
| 4 | 0.0 | 4.0 | 46.0 | 0.003019 |
| Li2O | TiO2 | La2O3 | |
|---|---|---|---|
| 0 | 0 | 1 | 9 |
| 1 | 0 | 2 | 8 |
| 2 | 0 | 3 | 7 |
| 3 | 0 | 4 | 6 |
| 4 | 0 | 5 | 5 |
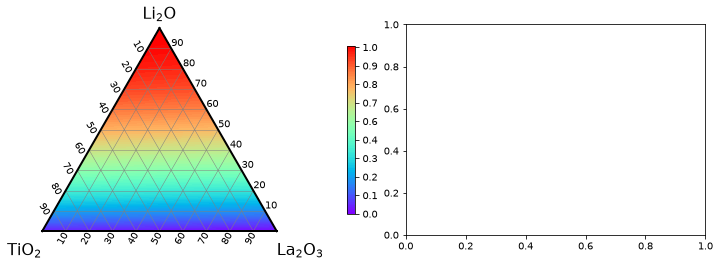
materials = df_contour.columns[0:3]

td1 = TernaryDiagram(materials=materials, ax=axes[0])
td1.contour(vector=df_contour[materials], z=df_contour["z"])

fig
materials = df_mono_scatter.columns[0:3]

td2 = TernaryDiagram(materials=materials, ax=axes[1])
td2.scatter(vector=df_mono_scatter[materials])

fig
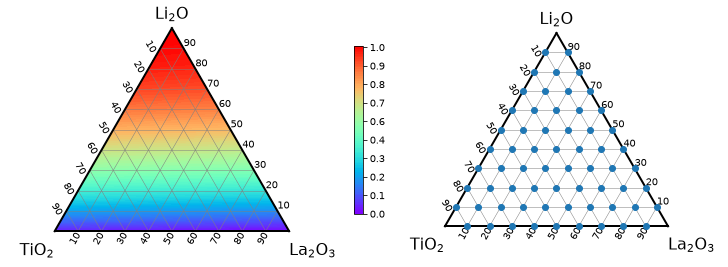
fig.savefig("multiple_figure.png", dpi=144)