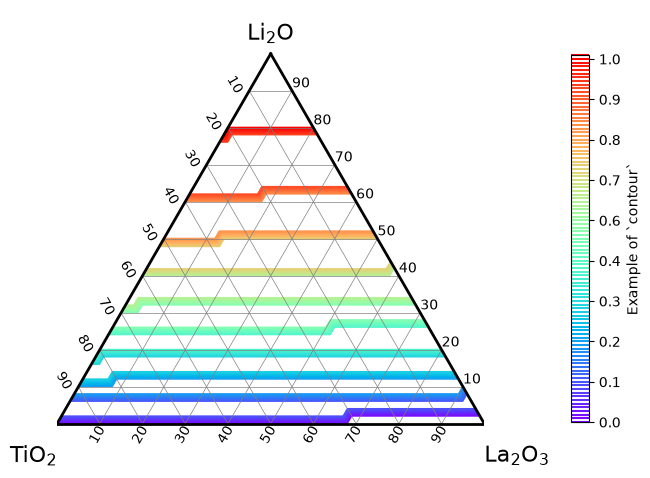
Contour map#
import modules#
import pandas as pd
import matplotlib.pyplot as plt

from ternary_diagram import TernaryDiagram
load example data for contour#
df = pd.read_csv("example_contour.csv")
df.head()
| Li2O | TiO2 | La2O3 | z | |
|---|---|---|---|---|
| 0 | 0.0 | 0.0 | 50.0 | 0.000000 |
| 1 | 0.0 | 1.0 | 49.0 | 0.000755 |
| 2 | 0.0 | 2.0 | 48.0 | 0.001509 |
| 3 | 0.0 | 3.0 | 47.0 | 0.002264 |
| 4 | 0.0 | 4.0 | 46.0 | 0.003019 |
Compounds at the vertices: the first three columns, in the order top, bottom left, bottom right.
materials = df.columns[0:3].tolist()
materials
['Li2O', 'TiO2', 'La2O3']
Easiest example#
fig, ax = plt.subplots(layout="constrained")
td = TernaryDiagram(materials=materials, ax=ax)
td.contour(df[materials], z=df["z"])
<matplotlib.tri._tricontour.TriContourSet at 0x117993d70>
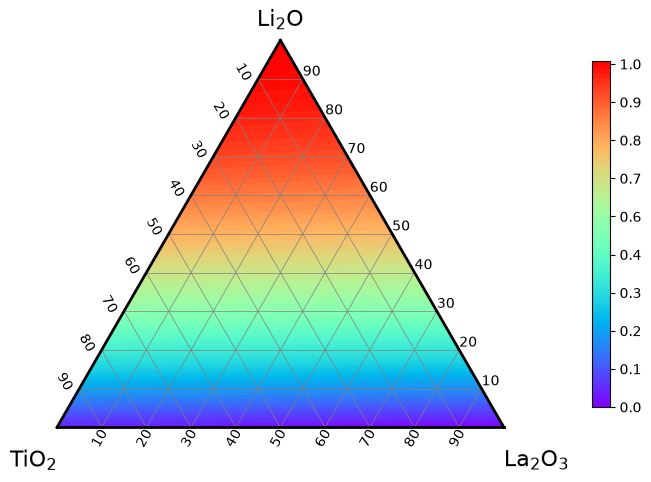
customize#
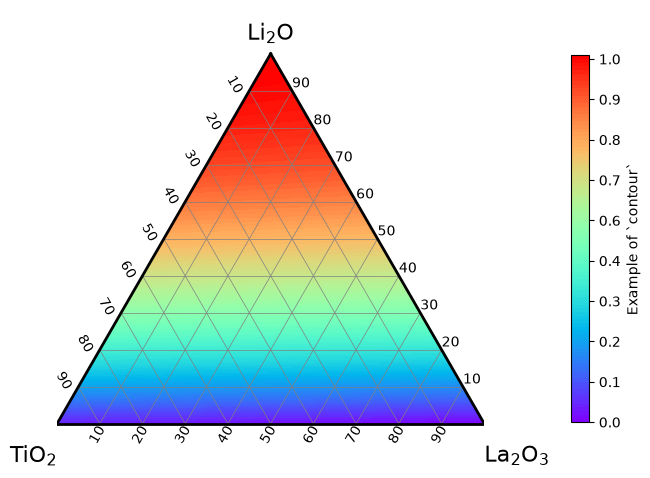
colorbar label#
fig, ax = plt.subplots(layout="constrained")
td = TernaryDiagram(materials=materials, ax=ax)
mappable = td.contour(df.iloc[:, :3], df.loc[:, "z"], colorbar=False)
# you can customize the colorbar like `plt.colorbar`
td.colorbar(mappable=mappable, label="Example of `contour`")
<matplotlib.colorbar.Colorbar at 0x117825c40>
td.fig.savefig("example_contour.png", dpi=144)
fig, ax = plt.subplots(layout="constrained")
td = TernaryDiagram(materials=materials, ax=ax)

mappable = td.contour(
    df.loc[:, materials], df.loc[:, "z"].round(1), colorbar=False, fill=False
)
# # you can customize the colorbar like `plt.colorbar`
td.colorbar(mappable=mappable, label="Example of `contour`")
<matplotlib.colorbar.Colorbar at 0x117d9a120>