Other distance metrics#
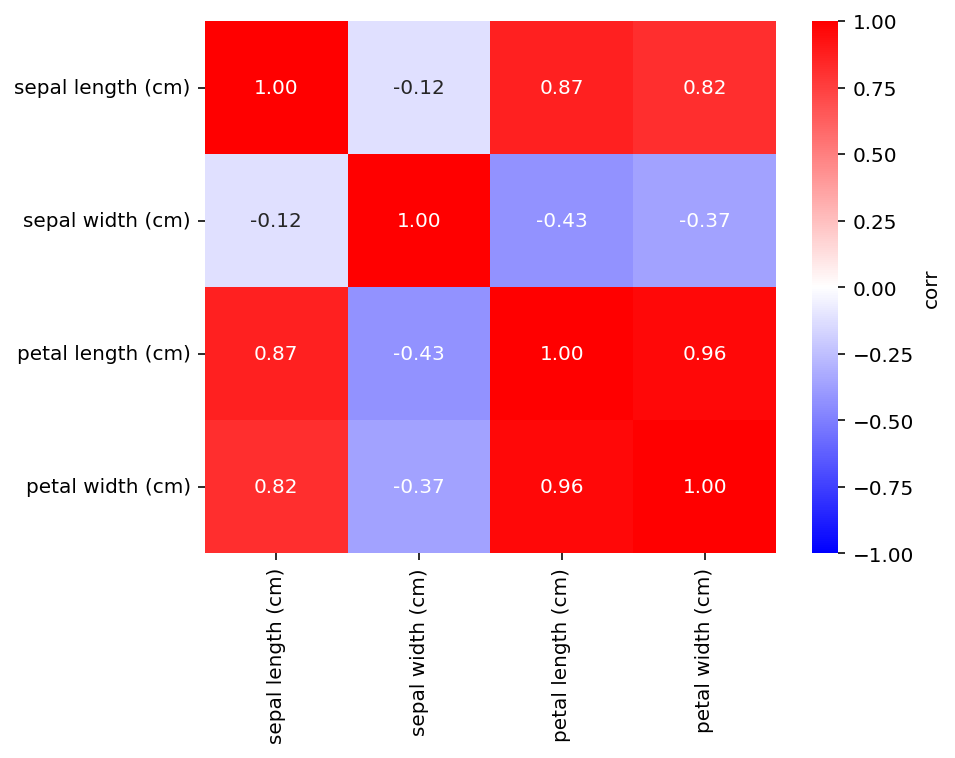
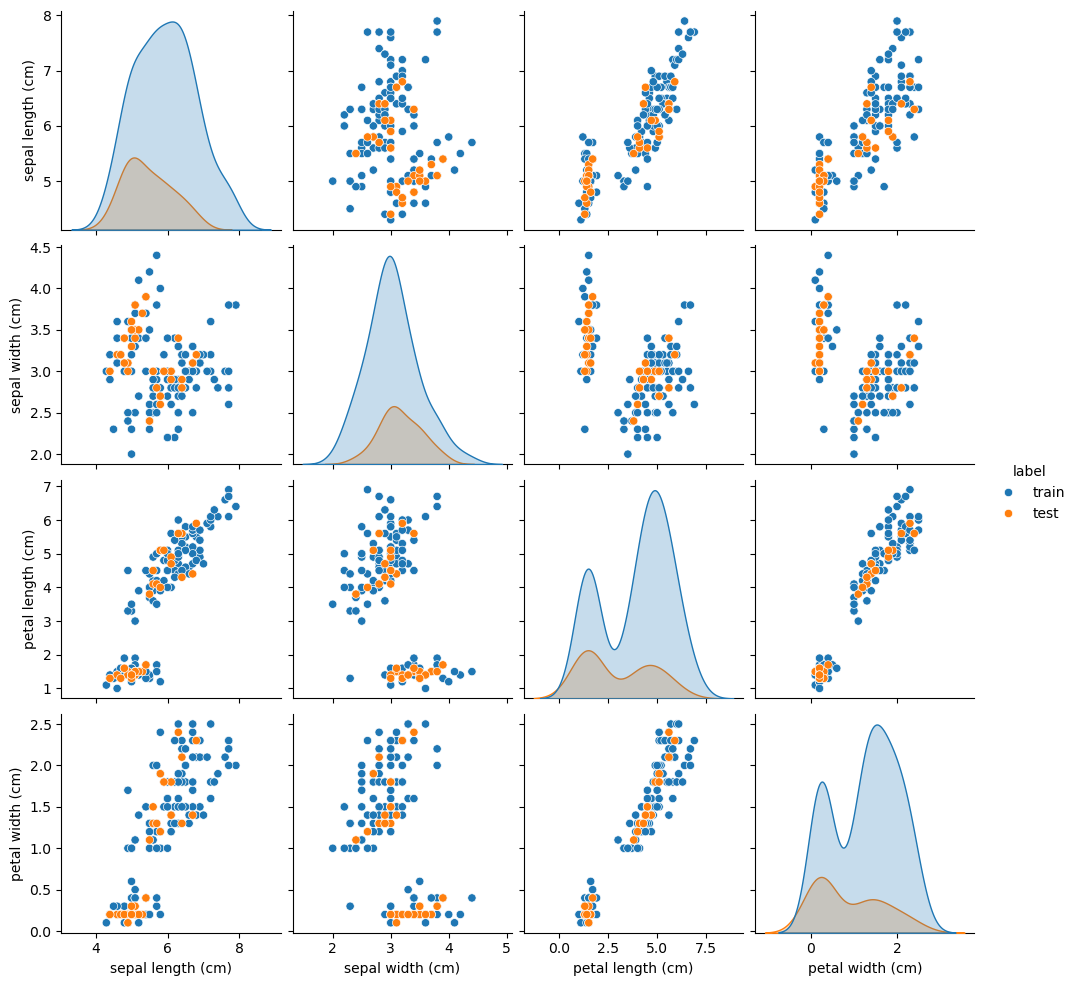
Compare the training and test splits obtained with different distance metrics (metric).
import matplotlib.pyplot as plt
import pandas as pd
import seaborn as sns
from sklearn.datasets import load_iris

from kennard_stone import train_test_split
X: pd.DataFrame
y: pd.Series
X, y = load_iris(as_frame=True, return_X_y=True)
display(X.head(), y.to_frame().head())
| sepal length (cm) | sepal width (cm) | petal length (cm) | petal width (cm) | |
|---|---|---|---|---|
| 0 | 5.1 | 3.5 | 1.4 | 0.2 |
| 1 | 4.9 | 3.0 | 1.4 | 0.2 |
| 2 | 4.7 | 3.2 | 1.3 | 0.2 |
| 3 | 4.6 | 3.1 | 1.5 | 0.2 |
| 4 | 5.0 | 3.6 | 1.4 | 0.2 |
| target | |
|---|---|
| 0 | 0 |
| 1 | 0 |
| 2 | 0 |
| 3 | 0 |
| 4 | 0 |
X_train_euc, X_test_euc, y_train_euc, y_test_euc = train_test_split(
    X, y, test_size=0.2, n_jobs=-1, metric="euclidean"
)
2026-11-07 18:25:21,314 - kennard_stone.utils._pairwise:115[INFO] - Calculating pairwise distances using scikit-learn.
2026-11-07 18:25:21,336 - kennard_stone.utils._pairwise:115[INFO] - Calculating pairwise distances using scikit-learn.
X_train_mah, X_test_mah, y_train_mah, y_test_mah = train_test_split(
    X, y, test_size=0.2, n_jobs=-1, metric="mahalanobis"
)
2026-11-07 18:25:21,365 - kennard_stone.utils._pairwise:115[INFO] - Calculating pairwise distances using scikit-learn.
2026-11-07 18:25:21,381 - kennard_stone.utils._pairwise:115[INFO] - Calculating pairwise distances using scikit-learn.
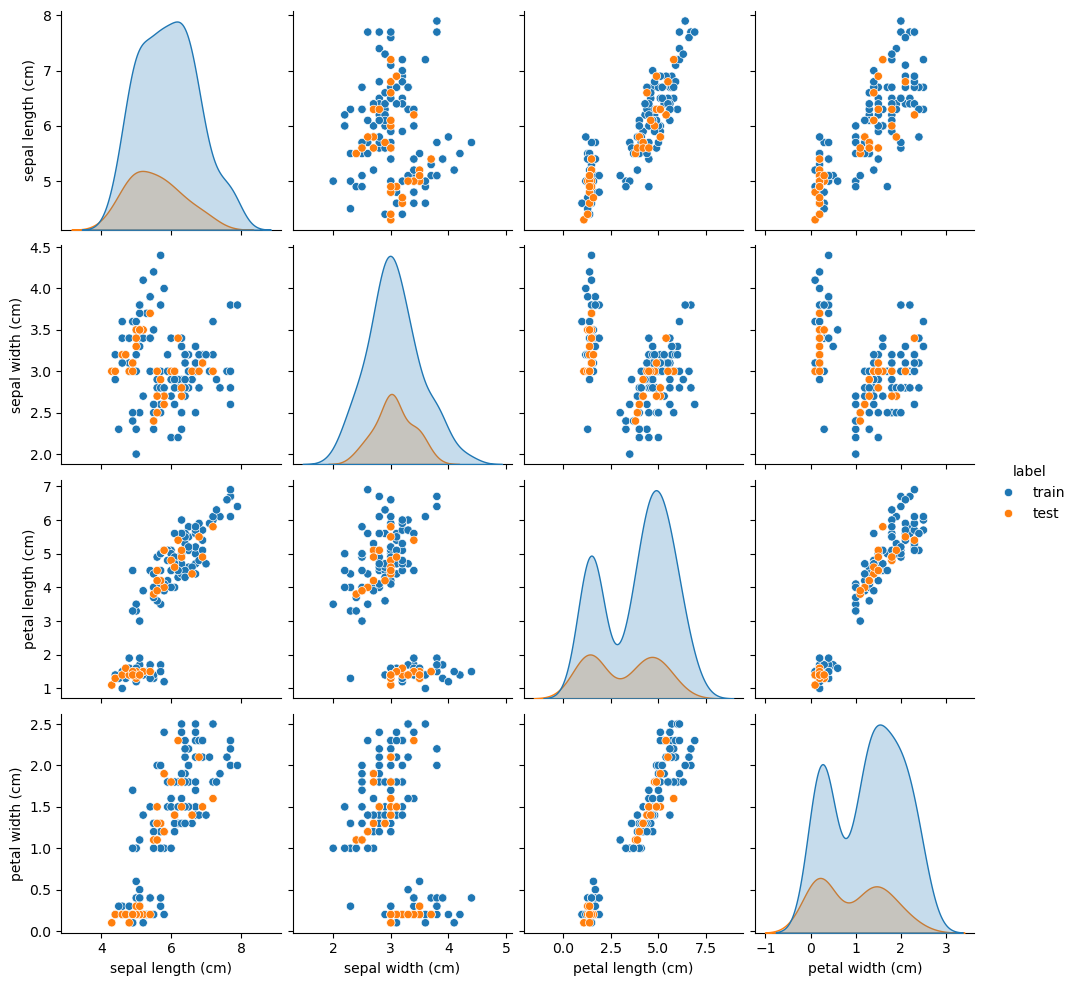
fig, ax = plt.subplots(dpi=144)
sns.heatmap(
    X.corr(),
    vmax=1,
    vmin=-1,
    cbar_kws=dict(label="corr"),
    cmap="bwr",
    annot=True,
    fmt=".2f",
    ax=ax,
)
<Axes: >
sns.pairplot(
    pd.concat(
        (
            pd.concat(
                (
                    X_train_euc,
                    pd.Series(
                        ("train",) * X_train_euc.shape[0],
                        name="label",
                        index=X_train_euc.index,
                    ),
                ),
                axis=1,
            ),
            pd.concat(
                (
                    X_test_euc,
                    pd.Series(
                        ("test",) * X_test_euc.shape[0],
                        name="label",
                        index=X_test_euc.index,
                    ),
                ),
                axis=1,
            ),
        ),
        axis=0,
    ),
    hue="label",
)
<seaborn.axisgrid.PairGrid at 0x16a7eb260>
sns.pairplot(
    pd.concat(
        (
            pd.concat(
                (
                    X_train_mah,
                    pd.Series(
                        ("train",) * X_train_mah.shape[0],
                        name="label",
                        index=X_train_mah.index,
                    ),
                ),
                axis=1,
            ),
            pd.concat(
                (
                    X_test_mah,
                    pd.Series(
                        ("test",) * X_test_mah.shape[0],
                        name="label",
                        index=X_test_mah.index,
                    ),
                ),
                axis=1,
            ),
        ),
        axis=0,
    ),
    hue="label",
)
<seaborn.axisgrid.PairGrid at 0x175908350>